| Language | |
|---|---|
| Eng | Spa |
COVID-19 in Mexico


A Year in Poster Series
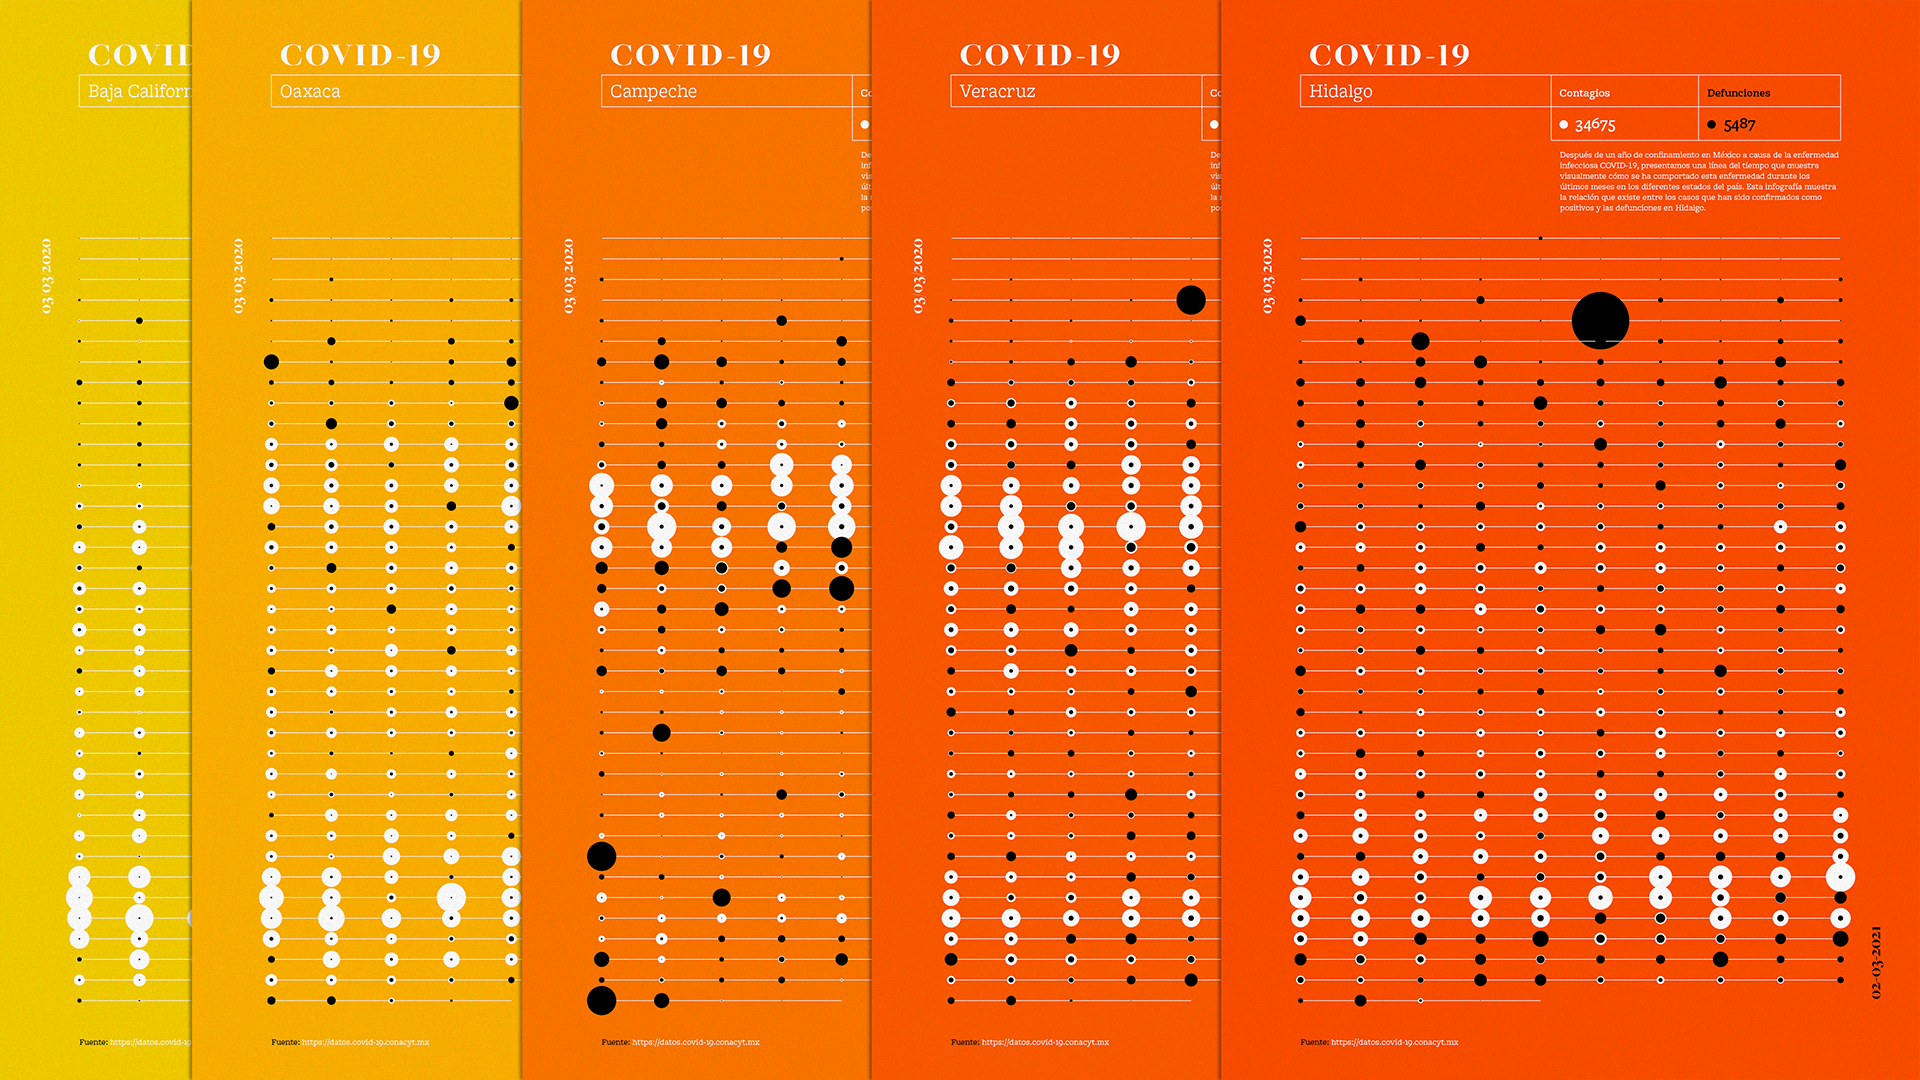
Poster series that narrates a year of COVID-19 in Mexico. Analyzing each of the states of the country, from 2020/03/02 to 2021/03/02. Using visual resources we made a timeline, where the white dots represent the confirmed cases and the black dots represent the percentage of deaths over them.
We assigned the background color by state according to the following operation. Historical total of deaths ÷ Historical total of confirmed cases.


Data from: datos.covid-19.conacyt.mx